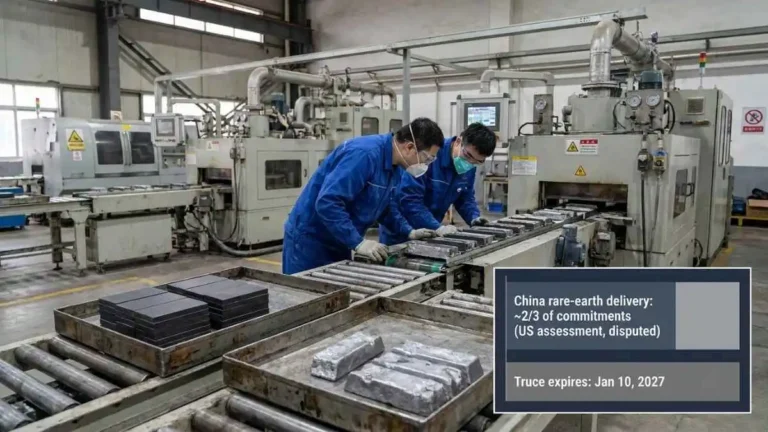
Does Geopolitical Tension Force Regionalization? What the Data Show

⏱️ 5 Mins Read
Geopolitical tension is raising the cost of distance in global supply chains, but 2023–2025 data show the start of a regionalization. Mexico is the clearest case. Evidence for the rest of North America, China, and the EU is mixed.
📌 Executive Brief
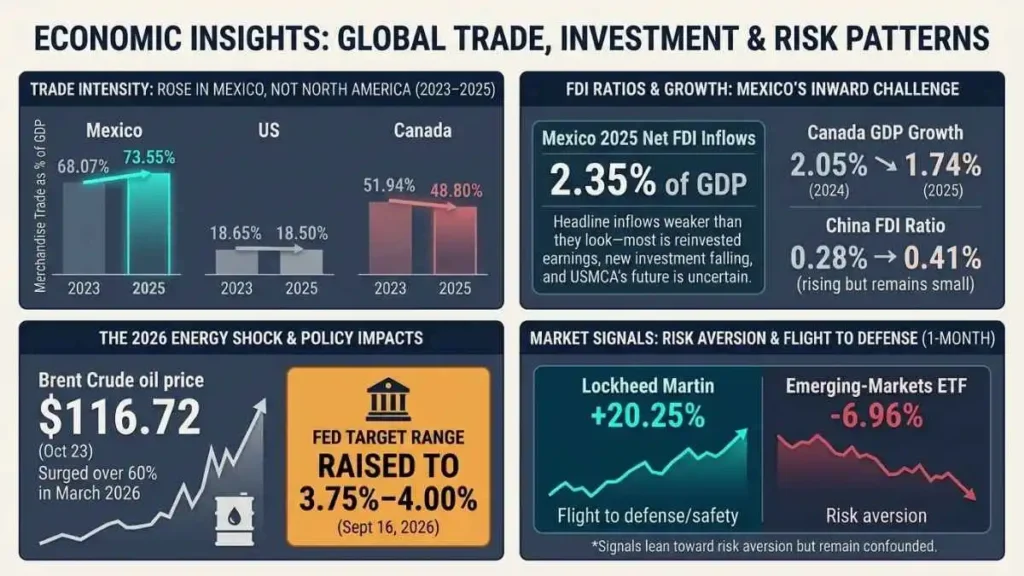
- Trade intensity rose in Mexico, not across North America. Mexico’s merchandise trade rose from 68.07% to 73.55% of GDP between 2023 and 2025. Over the same period, the US was flat (18.65% to 18.50%), and Canada’s fell (51.94% to 48.80%).
- FDI ratios in Mexico, Canada & China. Mexico’s net FDI inflows stood at 2.35% of GDP in 2025. Canada’s GDP growth declined from 2.05% in 2024 to 1.74% in 2025. China’s ratio stayed small at 0.41%, up from 0.28% in 2023.
- Mexico’s headline inflows are weaker than they look. Most of the capital is reinvested earnings, new investment is falling, and the USMCA’s future is uncertain.
- The 2026 energy shock is now visible in prices and policy. Brent crude surged more than 60% in March and settled at $116.72 on October 23. The Fed raised its target range to 3.75–4.00% on September 16.
- Market signals lean toward risk aversion but are confounded. Over one month, Lockheed Martin rose 20.25% while the emerging-markets ETF fell 6.96%.
The Cost of Distance Is Rising
For three decades, sourcing decisions weighted cost above continuity. Conflict in the Middle East is shifting that balance. The war that began on February 28, 2026 disrupted shipping through the Strait of Hormuz.
That disruption is one consequence of great-power economic competition between the US and Iran, which has reshaped energy corridors, technology supply chains, and the global financial architecture.
Brent rose more than 60% in March 2026, its largest monthly gain since records began in 1988, and peaked at $126.41 on April 30. It later fell back below $100 before returning above that level in September. In October, Brent is roaming between $105 to $117 per barrel, its strongest close since June 2022, after a gain of more than 10% in October.
US benchmark crude is moving in the same direction. WTI was $107.89 on October 20, and the front-month futures contract rose 9.77% over one month to $101.65. These two WTI figures differ because FRED reports daily spot prices and Yahoo reports a live futures quote captured at a different time.
Morgan Stanley notes that shipping costs, not just supply shortages, are now driving much of the price strength. That supports the argument that long-haul sourcing has become more expensive. The datasets used here do not measure freight costs directly, so that link is analytical, not measured.
Trade Intensity: A Mexico Story, Not a Continental One
| Trade Intensity | 2023 | 2024 | 2025 |
| Mexico | 68.07 | 69.54 | 73.55 |
| United States | 18.65 | 18.50 | 18.50 |
| Canada | 51.94 | 50.26 | 48.80 |
| China | 32.49 | 32.88 | 32.59 |
| European Union | 76.60 | 72.22 | 70.94 |
Points confirming the regionalization:
- Mexico’s base year is a trough. World Bank data show Mexico’s merchandise trade at 82.10% of GDP in 2022. The 2023 dip coincides with a jump in USD GDP per capita from $11,402 to $13,826, so part of the later rise reflects a recovery against a larger denominator.
- China’s trade intensity did not fall. It stayed within 32.5- 32.9% of GDP. Any decoupling shows up in capital allocation, not goods-trade volume.
- The EU decline cannot be read as internal consolidation. The EU ratio fell the most in the sample. But the aggregate far exceeds Eurostat’s extra-EU measure (22.4% of GDP for goods and services in 2023) [Eurostat], which indicates it includes trade between member states.
Mexico also remains tied to Asian inputs: low- and middle-income East Asia and Pacific economies supplied 25.70% of its merchandise imports in 2023. Regionalization is real at the margin but incomplete.
Capital Flows: Higher in Mexico and Canada, Small but Rising in China
| Capital Flow | 2023 | 2024 | 2025 |
| Mexico | 1.71 | 2.49 | 2.43 |
| Canada | 2.00 | 2.78 | 3.02 |
| United States | 1.26 | 0.85 | 1.00 |
| China | 0.28 | 0.23 | 0.41 |
| European Union | -1.26 | 1.01 | 1.23 |
- Mexico. The surge occurred in 2024, and 2025 edged down. In dollars, UNCTAD reports roughly $41bn of inflows in 2025, up about $3bn from 2024.
- Canada. Its ratio rose by about 1.0 percentage point versus Mexico’s 0.7, and its 2025 level is higher. Mexico is the largest beneficiary in trade intensity, not necessarily in capital.
- China. The ratio fell in 2024 and rebounded in 2025. It remains low relative to Mexico and Canada, though a ratio for a very large economy is sensitive to its denominator.
- United States. The ratio is modest, but the US remains the largest FDI recipient in dollar terms, at about $277 billion to $279 billion in 2025. Ratios flatten smaller economies.
- European Union. UNCTAD’s headline series also turned positive in 2024, after negative readings in 2022 and 2023, then eased to about $164bn in 2025 from about $231bn in 2024. UNCTAD warns that conduit flows through major European financial centers distort headline figures. The sign change should not be read as a strategic pivot.
The Quality of Mexico’s Capital
The composition of Mexico’s inflows tempers the nearshoring narrative:
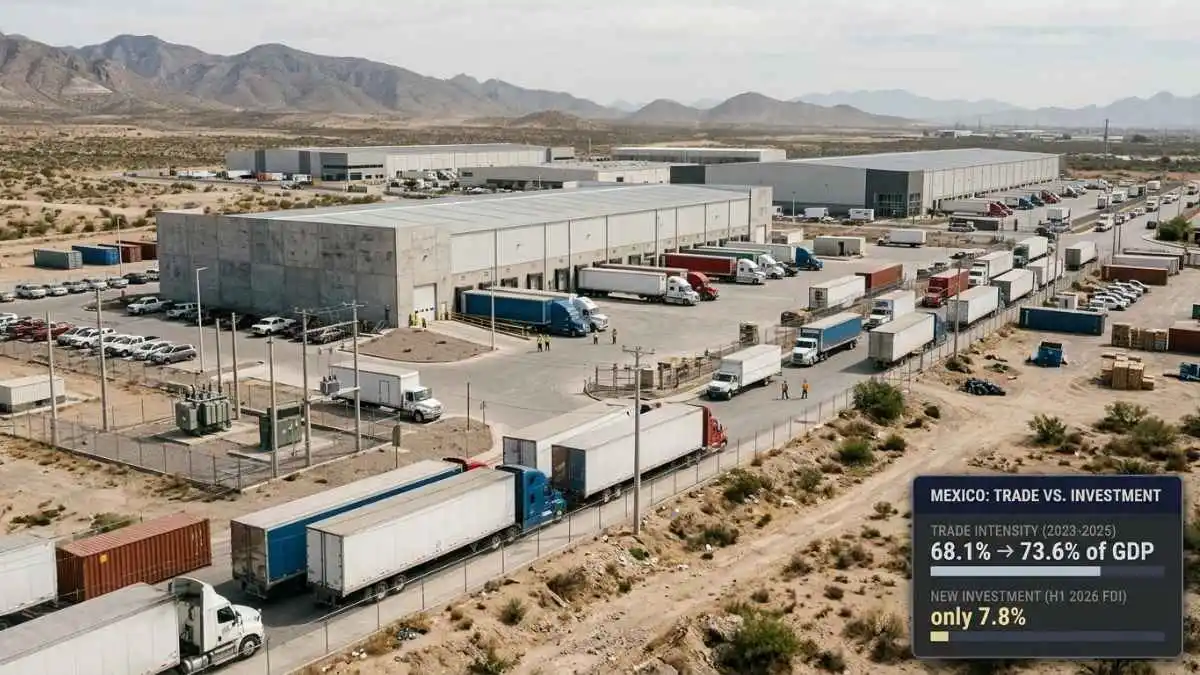
- Reinvested earnings accounted for 67.7% of 2025 inflows, and new investment for 18.0%.
- In the first half of 2026, headline FDI reached nearly $35bn, a record for the period. New investment accounted for only 7.8% of that total and fell 13% year on year.
- Greenfield investment fell by nearly half to $24bn in 2025, and nearshoring announcements fell 78% year on year in Q1 2026.
- The USMCA’s first joint review in July 2026 reportedly ended without an extension, shifting the pact to annual reviews. Investors say this is delaying new projects.
Reinvested earnings show that firms already in Mexico are staying. They do not show that new firms are arriving, which is what a structural realignment would require.
I also examined the structural asymmetry in the US-Mexico trade relationship, and why Mexico’s negotiating position is weaker than its trade numbers suggest.

Inflation and Monetary Policy
| CPI inflation % | 2023 | 2024 | 2025 |
| United States | 4.12 | 2.95 | 2.7 |
| Canada | 3.88 | 2.38 | 2.07 |
| Mexico | 5.53 | 4.72 | 3.81 |
| China | 0.23 | 0.22 | 0.06 |
| European Union | 6.30 | 2.44 | 2.47 |
- United States. The seasonally adjusted CPI index rose from 332.813 in July to 334.131 in August and 336.298 in September, up 0.40% and 0.65%, respectively. The Fed held at 3.50–3.75% in July, then on September 16 raised the target range by 25 basis points to 3.75–4.00%, unanimously and for the first time since 2023. The effective rate averaged 3.63% in July and August and 3.75% in September, which blends pre- and post-hike days.
- Energy is not the only driver. At the September meeting, headline PCE inflation was 3.4%, and core was 3.0%. The hike cannot be attributed to energy alone.
- China. The near-zero 2025 reading has given way to energy-led increases. CPI rose 0.9% year on year in September 2026, with gasoline up 16.6%. In August, PPI rose 3.8%. China is not insulated from the shock.
- Medium-term expectations.IMF DataMapper projections for 2028–2031 show US/Canada inflation at 2%, Mexico at 3.0%, and China at 1.6–2.0%.
Higher policy rates do not by themselves reroute supply chains. They do raise the carrying cost of the extra inventory that just-in-case strategies require, which is an analytical point and not a measured effect.
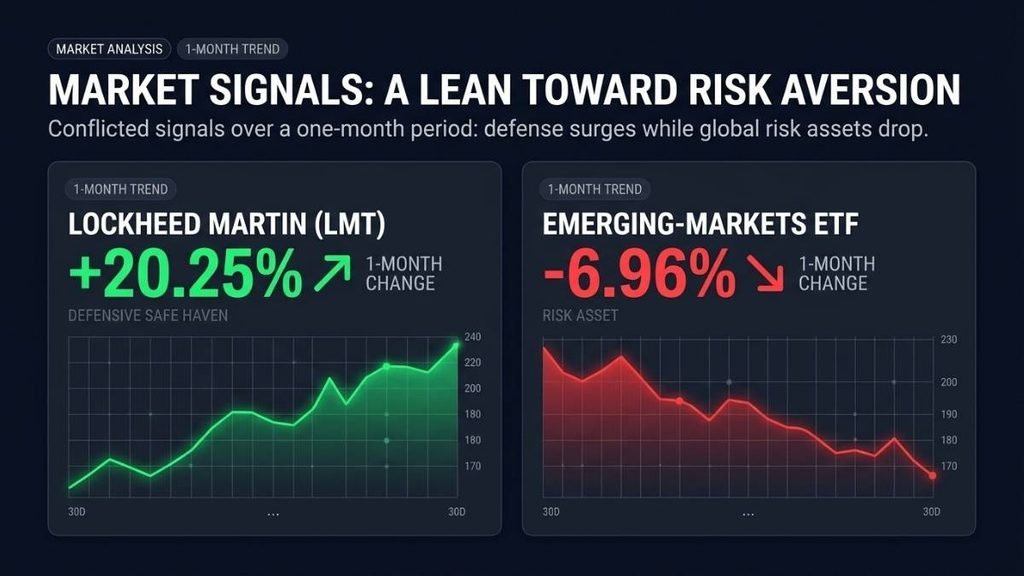
These moves align with a risk-off tilt: higher energy prices, a firmer dollar, stronger defense equities, and weaker emerging-market equities. They do not prove that investors are pricing “supply chain security,” for four reasons:
- Company-specific news. Lockheed reported Q3 results October 22 and raised its outlook.
- Window-dependent results. One-month windows vary widely. An earlier 30-day window showed LMT down about 8.9%.
- Broad exposure. EEM spans many economies, including Mexico, and remains above its end-2025 level of $54.71 [Digrin].
- Price versus flows. Price changes are not fund flows.
Geopolitical tension is raising the cost of distance. The 2026 energy shock, record crude volatility, and a Fed tightening cycle all push firms to value proximity and continuity more than before. The data support a narrower claim than the end of globalization: regionalization is advancing unevenly, most clearly in Mexico’s trade intensity and in capital flowing to Mexico and Canada. China’s goods-trade intensity is stable, and its investment ratio is small but rising. The EU’s figures are distorted by intra-EU trade and conduit flows. Whether firms are actively shortening supply chains in response remains difficult to measure directly from trade and FDI ratios alone.
For businesses and policymakers, four indicators will show whether this becomes structural:
- The share of new investment in Mexico’s FDI, now falling.
- The outcome of the USMCA’s annual reviews.
- The path of Brent and freight costs.
- Whether the Fed’s tightening is reinforced or reversed as inflation data evolve.
Read more analysis in our Great Power Economics section.